This is an old post and is probably extremely cringe. Please understand that I have moved on from these ideas. Still, it may contain some nuggets that point to some continuity in my thinking over the years, which is why I decided to post it here.
Getting Along with Gephi
Over the last week or two I’ve been getting used to working with Gephi to visualize networks. I’ve tinkered around before but now I finally had some real data to work with, even if it’s very rudimentary. I realize that I’m going to need to add to it, but one step at a time. Carleton doesn’t have copies of many of the excavation reports that I need, so I may need to venture afar to collect and record the data I need. Who’s up for a road trip?
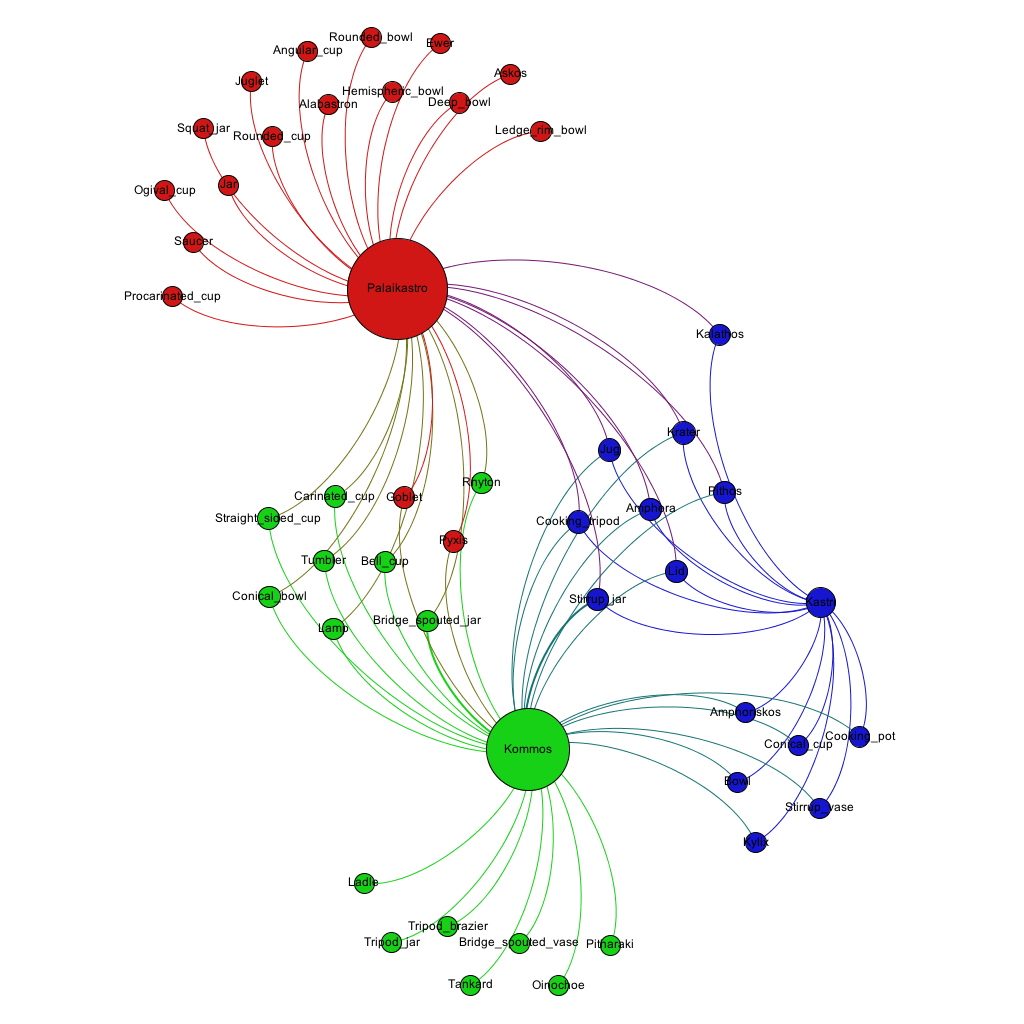
Even though the network I ran is very simple, it’s still progress in the right direction. Take a look:
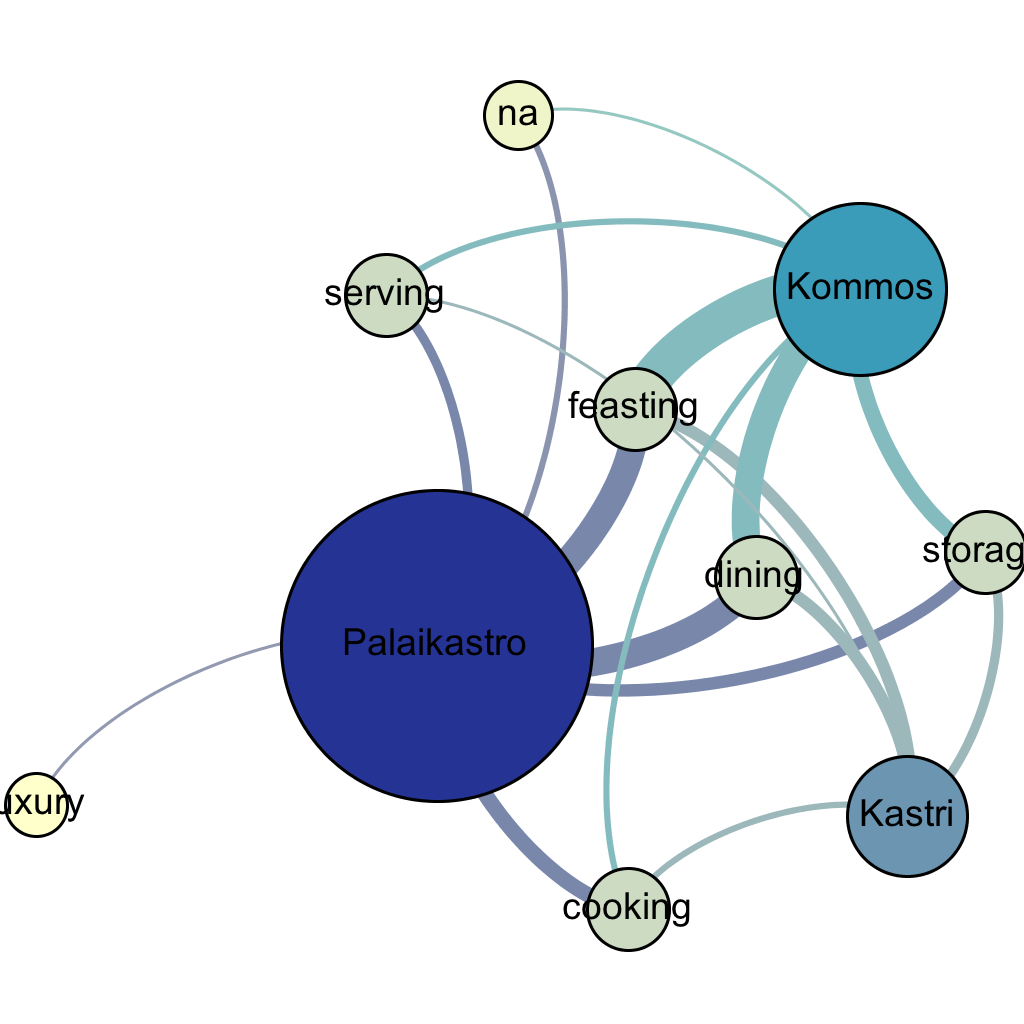
Dr. Graham took a look at the data and arranged it so the nodes represent the purpose of the pottery, rather than the type. I tweaked it a bit before posting it, just to make it look better. Here it is:
So far I’m getting the hang of things. I find that by controlling the software I can get a better grasp of what network analysis is all about. I’m guess you can say I’m a big proponent of learning by doing!